Use of Grafana
By having the metrics from the performance measurement tool go into Carbon, we can visualize them in the standalone mode of StorPerf by running a Grafana instance on the StorPerf Manager.
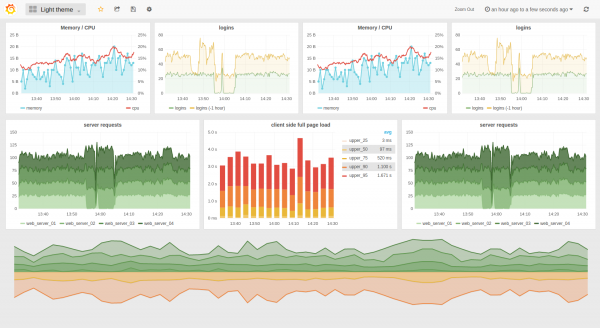
Here is an example of the different types of graphs that can be displayed.
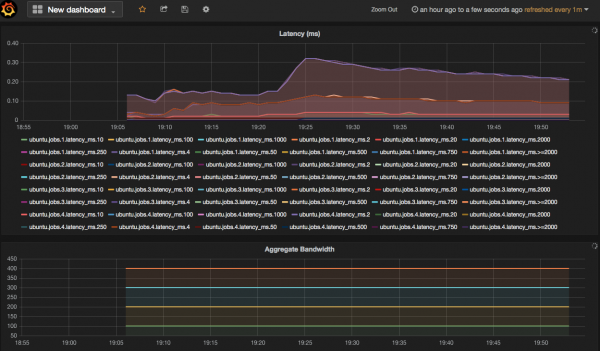
I did a test run on a VM running under VMware Fusion and plotted all the latencies and this is what it looks like. A little too busy, but the plan is to aggregate it into one average for the entire run.

