This is an old revision of the document!
An easy option to get started with graphing performance and event logs from test runs is to just use Jenkins with some plugins.
The advantage to having Jenkins do this is the data is readily available for each job. As the number of jobs increased and mining, trends, and more sophisticated numerical data analysis and logging investigation is required the data can also be pushed to external databases such as splunk and logstash.
This plugin provides generic plotting (or graphing) capabilities in Jenkins.
This plugin will plot one or more single values variations across builds in one or more plots. Plots for a particular job (or project) are configured in the job configuration screen, where each field has additional help information. Each plot can have one or more lines (called data series). After each build completes the plots' data series latest values are pulled from Java properties file(s), CSV file(s), or XML file(s) via an XPath (which you should have generated during the build) somewhere below you workspace. Data for each plot is stored in a CSV file within the job's root project directory.
It can generate various kind of plots, including Area, Bar, Line, Stacked Bar, Waterfall…
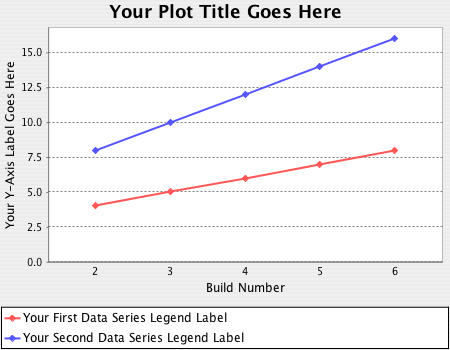
Here is an example of the plots generated by this plugin:

See more details here: https://wiki.jenkins-ci.org/display/JENKINS/Plot+Plugin
