This is an old revision of the document!
Testing Dashboard
Admin
It was decided to adopt the Mongo DB/API/Json approach dashboard meeting minutes
Introduction
All the test projects generate results in different format. The goal of a testing dashboard is to provide a consistent view of the different tests from the different projects.
Overview
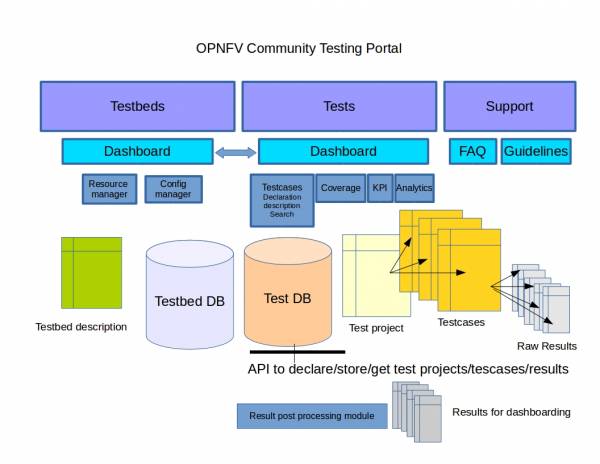
We may describe the overall system dealing with test and testbeds as follow:

We may distinguish
- the data collection: Test projects push their data using a REST API
- the production of the test dashboard: the LF WP develop a portal that will call the API to retrieve the data and build the dashboard
Test collection
The test collection API is under review, it consists in a simple Rest API associated a Mongo DB.
Most of the tests will be run from the CI but test collection shall not affect CI in any way that is one of the reason to externalize data collection and not using a jenkins Plugin.
Dashboard
A module shall extract the raw results pushed by the test projects to create a testing dashboard. This dashboard shall be able to show:
- The number of testcases/test projects/ people involved/organization involved
- All the tests executed on a a given POD
- All the tests from a test project
- All the testcases executed on all the POD
- All the testcases in critical state for version X installed with installer I on testbed T
- ….
It shall be possible to filter per:
- POD
- Test Project
- Testcase
- OPNFV version
- Installer
- …
For each test case we shall be able to see:
- Error rate versus time
- Duration versus time
- Packet loss
- Delay
- ….
And also the severity (to be commonly agreed) of the errors…
| description | comment |
|---|---|
| critical | not acceptable for release |
| major | failure rate? , failed on N% of the installers? |
| minor |
The expected load will not be a real constraint.
In fact the tests will be run less that 5 times a day and we do not need real time (upgrade evey hours would be enough).
Role of the test projects
Each test project shall:
- declare itself using test collection API (see Description)
- declare the testcases
- push the results into the test DB
- Create a <my_project>2Dashboard.py file into releng, This file indicate how to produce "ready to dashboard" data set, that are exposed afterwards through the API
| Project | testcases | Dashboard ready description |
|---|---|---|
| Functest | vPing | graph1: duration = f(time) graph 2 bar graph (tests run / tests OK) |
| Tempest | graph1: duration = f(time) graph 2 (nb tests run, nb tests failed)=f(time) graph 3: bar graph nb tests run, nb failed |
|
| odl | ||
| rally-* | ||
| yardstick | Ping | graph1: duration = f(time) graph 2 bar graph (tests run / tests OK) |
| VSPERF | ||
| QTip |
First studies for dashboarding
- home made solution
- bitergia, as used for code in OPNFV http://projects.bitergia.com/opnfv/browser/
- Logstash plugin for Jenkins that could be used with ELK solution
- remote Jenkins API + drupal + js lib (jqplot, ..)
Visualization examples
- Example of home made solution on functest/vPing: vPing4Dashboard example
- Example view of using the ELK stack (elasticsearch, logstash, kibana):
- Visualize Functest (vPing/Tempest) results: ELK example for FuncTest
